
ECONARIO
This robotic plant shows how your political choices today, impact biodiversity tomorrow.
In collaboration with the Natural History Museum (UK)

Based on the social economic scenarios we choose today, this work visualises the biodiversity of tomorrow.
The artwork grows or declines based on the implications of five socio-economic scenarios on biodiversity.

Showing that every vote we cast today, is a vote for the future we want for our children and grandchildren.
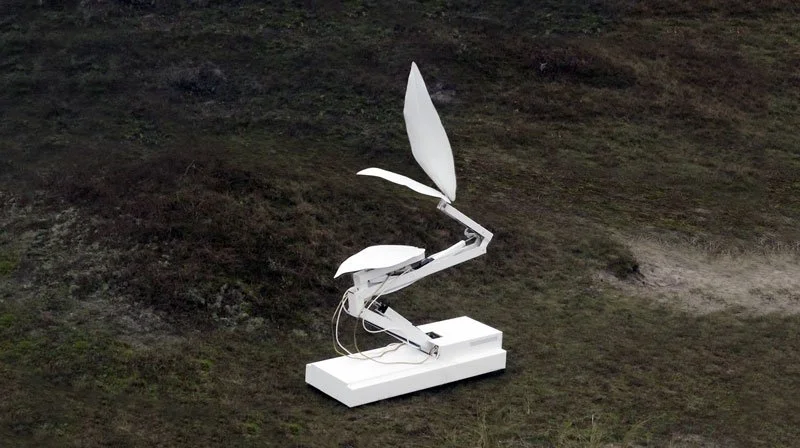
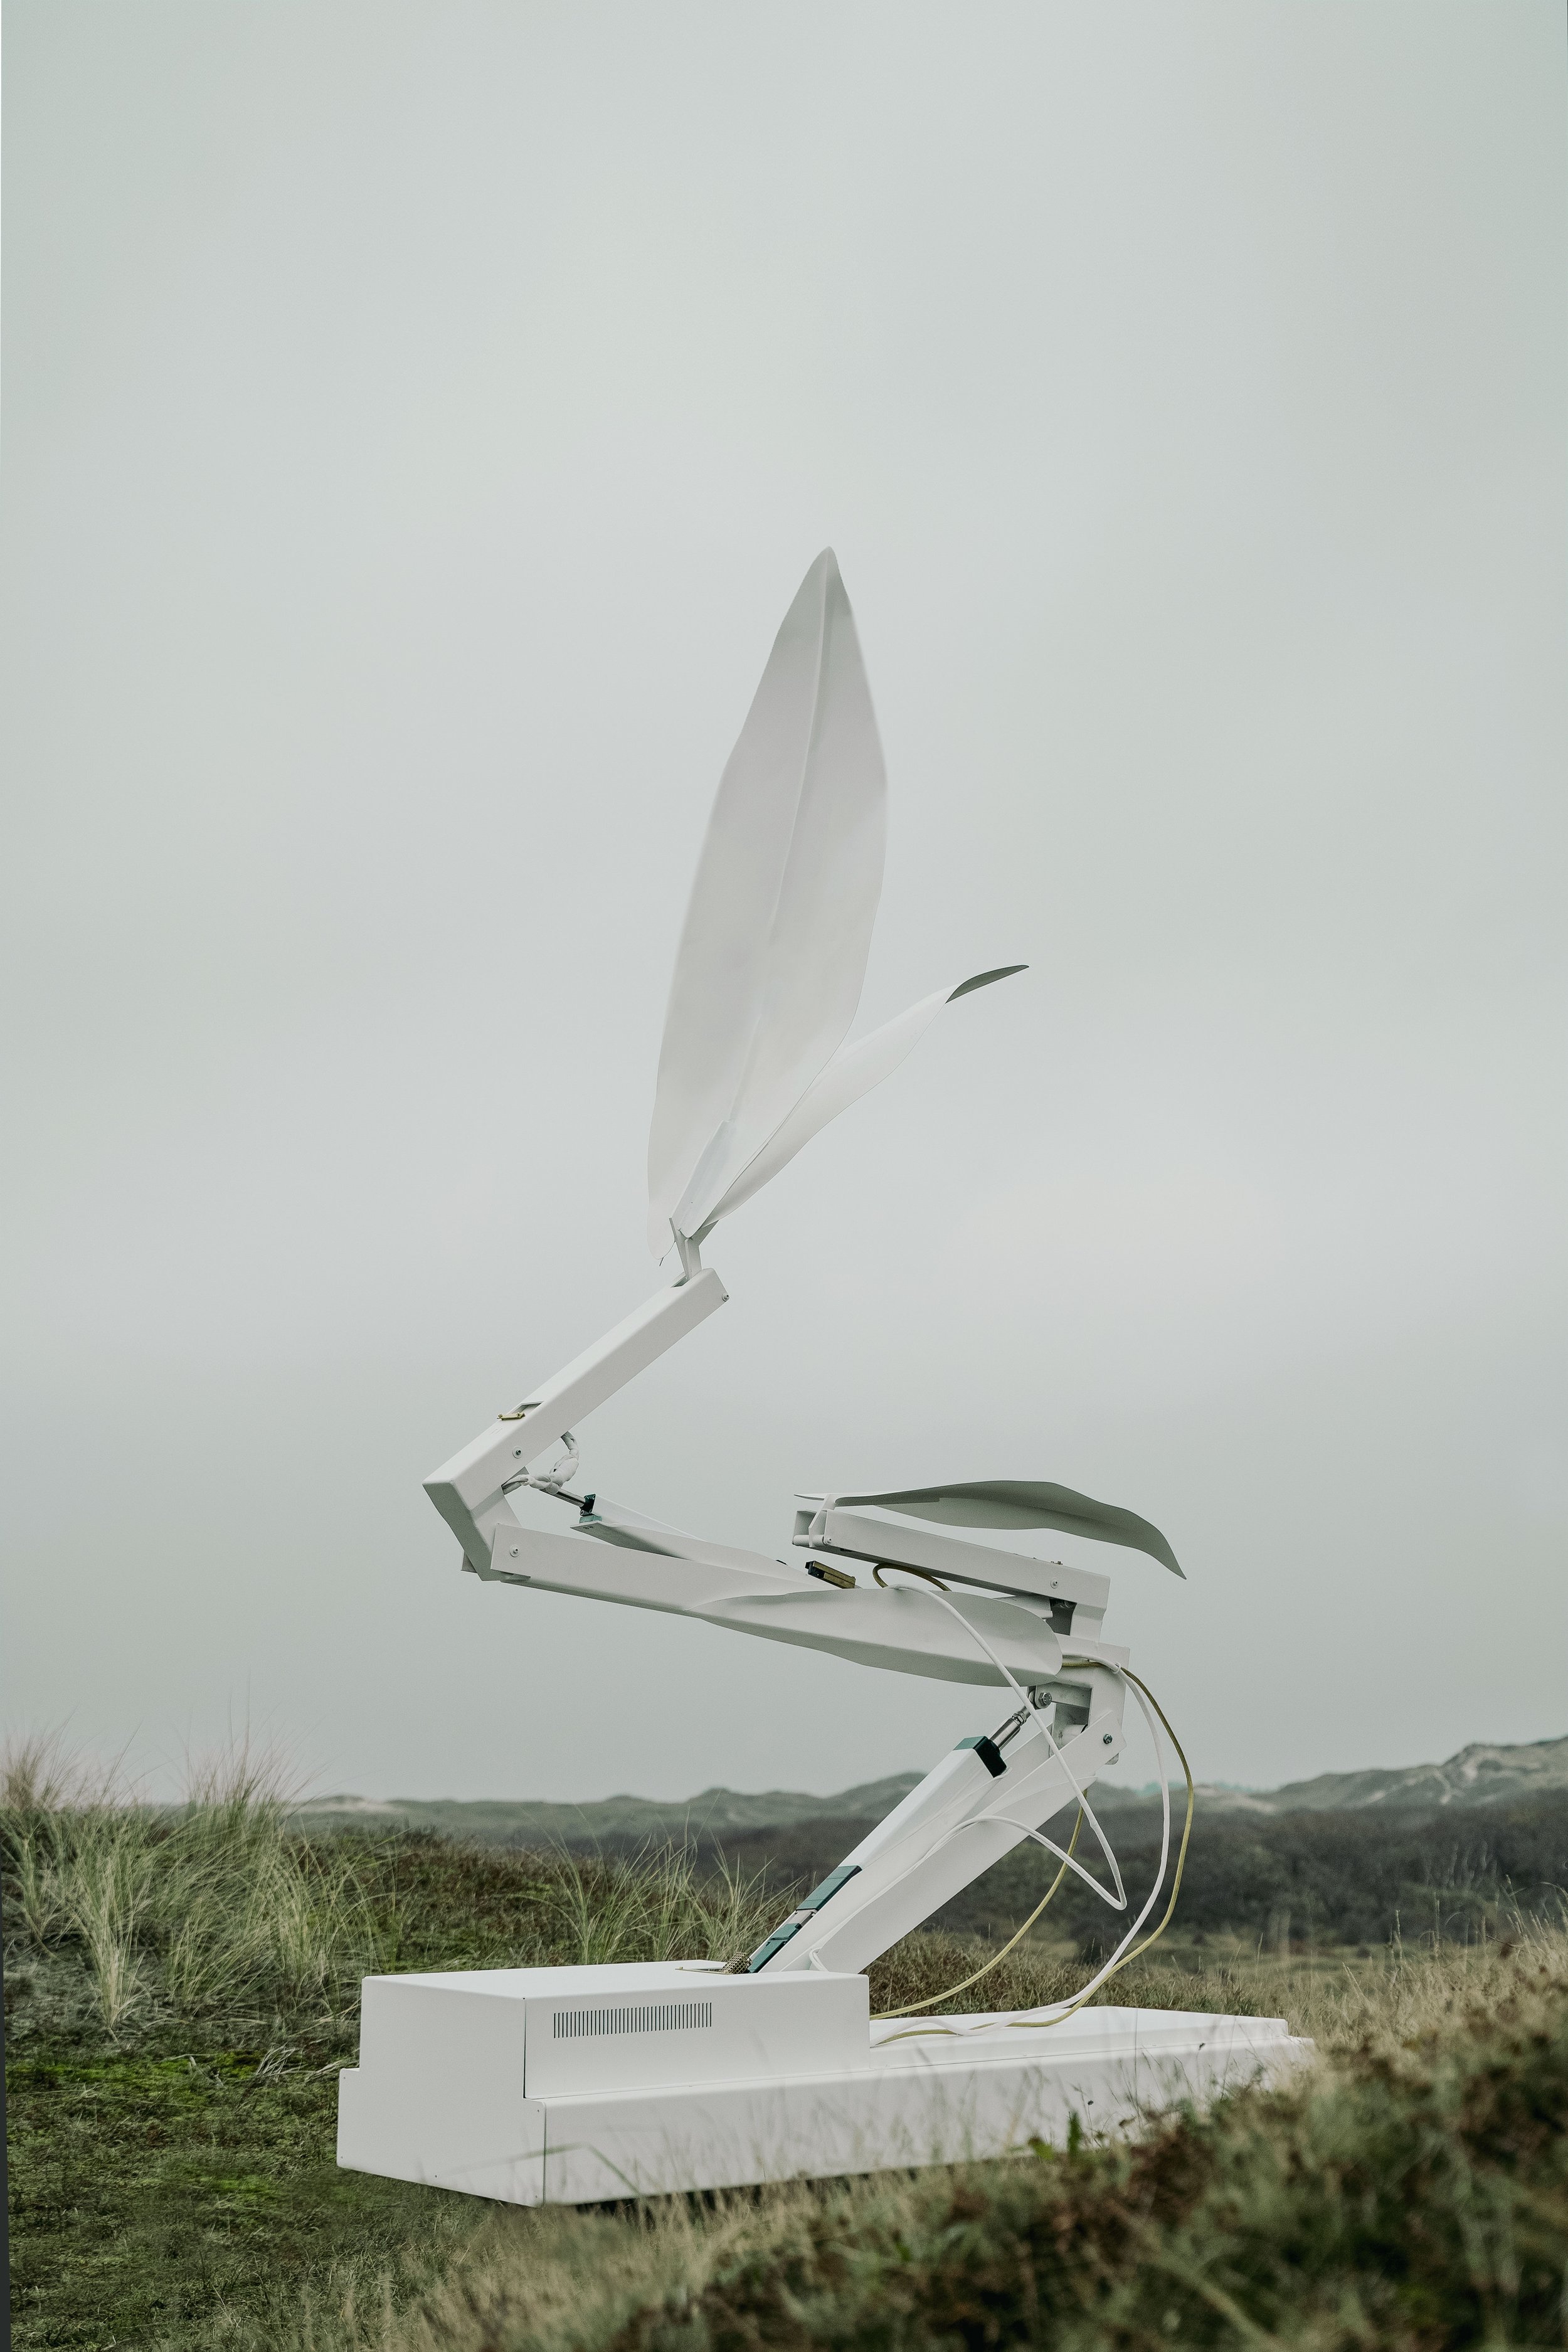
Ecological artist Thijs Biersteker has created a 5-metre-tall robotic plant, growing on biodiversity prediction data from the Natural History Museum. Creating a (literally) moving monument to the importance of the political choices we are making now for the future of our planet. The artwork ‘Econario’ provides a powerful representation of how choices society makes today will affect the state of nature over the next thirty years. Visitors see the impact of a nationalistic American government, unequal Dutch society, or a just-ignore-everything Chinese politics on the biodiversity of 2050.
The work is moving like a small fragile seedling finding its way up. The robotic plant is growing, not with the help of nutrients, but driven by data from the Biodiversity Intactness Index (BII) developed by the Natural History Museum. A dataset that shows the future of biodiversity based on our political choices.
When the artwork is folded the plant has an industrial look, but when the biodiversity increases and the work unfolds the plant-like motion gives the work an organic feel. As the artwork switches between countries, it is showing the biodiversity intactness in 2050 based on 5 different political scenarios we as a society can choose today.
For example, when the Netherlands will choose a sustainable scenario, the artwork grows towards its full 5 meters length. However, a scenario with a government that keeps burning fossil fuels like it’s 2022, will make the artwork decline rapidly. Showing visitors the 2050 scenario of an on equality based society in America, to a nationalistic government in Denmark which surprisingly increases the biodiversity.
“This work is important at this moment in time. Knowing all the data it’s still hard to imagine what the future could look like these days. This work shows how woven our environmental choices of today are with that of our future. With the help of the BII data from the Natural History Museum, we can provide and provoke a small glimpse of those futures, even a small slice of hope if we choose the right path.”
The artwork makes distant data personal by featuring data from the location where the work is being exhibited. It is showing us a choice in a time when we still have a choice. Giving us a path to change in a time of climate change.
The plantanoid work visualises the future worlds we all have a stake in choosing and it also provokes an emotional response. Or as a biologist visiting Woven Studio said; “please can I spend some time alone with the work? I don't understand how I can feel the same empathy for a robot as I do for the plants I work with every day as a biologist.”
“I am blown away by this piece. The numbers around biodiversity loss are cold hard facts, but cold hard facts never grabbed anyone by the heart. With ‘Econario’, you feel joy when it grows and becomes more natural; and you feel pain when it wilts. It has soul. And it really brings home what’s at stake.”
Indicated by small screens on the sides of the work the visitor can see what scenario is being visualized, on which location and the percentages of growth or decline in 2050 compared to today. In the exhibition space a moving information graphic shows a deep-dive into the science behind the data developed by the Natural History Museum.
Visitors learn that when biodiversity intactness reaches 90% or more, the area is resilient and a functioning ecosystem. When intactness falls to 30% or less, visitors will be warned that the area’s ecosystem is at risk of collapse. Few countries are at 90% today, and most of the scenarios suggest even fewer will be in 2050.

Data partner
Natural History Museum (UK)

Artist
Thijs Biersteker
Scientific Lead
Prof Andy Purvis and Dr Adriana De Palma
Studio Director
Sophie de Krom
Technical engineer
Tom Bekkers
Technical build
Bastiaan Kennedy, Sander van Gelder
Technical development
Jochem Esser, JBS Technics
Frontend developer
Bas van Oerle
Sustainably created at
Woven Studio
Thanks to
The Natural History Museum London, Sara Contu, Kunstkerk Dordrecht, Boris Gunst, Nathan Pottier, Madelief Broekman, Dennis van der Sluijs
Credits film/photography
Director: Jerom Fischer
DP: Thomas Fibbe
AC: Harvey Pieper
Grading: Jan Maarten de Wit
Sound: End of Time
Photography: Thijs Biersteker, Jerome Fischer, Cas Kerrsens
Data Netherlands
Sustainability (Taking the Green Road) SSP1

Regional rivalry (A Rocky Road) SSP3

Fossil-Fueled Development (Taking the Highway) SSPP5


ABOUT THE DATA

SCENARIOS FOR THE NETHERLANDS
The Biodiversity Intactness Index (BII) summarises the change in ecological communities in response to human pressures. The BII is an estimated percentage of the original number of species that remain and their abundance in any given area, despite human impacts. It is calculated using data from ecological studies conducted around the world. This data includes around 54,000 species, encompassing not only birds and mammals, the groups most often used in biodiversity indicators, but also plants, fungi and insects.
View a world map of the BII and find out more about how the Natural History Museum calculates the BII.
Shared Socio-Economic Pathways (SSP) Scenarios
The SSPs provide narratives describing alternative socio-economic developments. These storylines are a qualitative description of logic relating elements of the narratives to each other. In terms of quantitative elements, they provide data accompanying the scenarios on national population, urbanization and GDP (per capita). The SSPs can be quantified with various Integrated Assessment Models (IAMs), to explore possible future pathways both with regards to socioeconomic and climate pathways.
SSP2: Middle of the Road; The world follows a path in which social, economic, and technological trends do not shift markedly from historical patterns. Development and income growth proceeds unevenly, with some countries making relatively good progress while others fall short of expectations. Global and national institutions work toward but make slow progress in achieving sustainable development goals. Environmental systems experience degradation, although there are some improvements and overall the intensity of resource and energy use declines. Global population growth is moderate and levels off in the second half of the century. Income inequality persists or improves only slowly and challenges to reducing vulnerability to societal and environmental changes remain.
SSP4: Inequality (a road divided); Highly unequal investments in human capital, combined with increasing disparities in economic opportunity and political power, lead to increasing inequalities and stratification both across and within countries. Over time, a gap widens between an internationally-connected society that contributes to knowledge- and capital-intensive sectors of the global economy, and a fragmented collection of lower-income, poorly educated societies that work in a labor intensive, low-tech economy. Social cohesion degrades and conflict and unrest become increasingly common. Technology development is high in the high-tech economy and sectors. The globally connected energy sector diversifies, with investments in both carbon-intensive fuels like coal and unconventional oil, but also low-carbon energy sources. Environmental policies focus on local issues around middle and high income areas.
SSP1: Sustainability (taking the green road)
he world shifts gradually, but pervasively, toward a more sustainable path, emphasizing more inclusive development that respects perceived environmental boundaries. Management of the global commons slowly improves, educational and health investments accelerate the demographic transition, and the emphasis on economic growth shifts toward a broader emphasis on human well-being. Driven by an increasing commitment to achieving development goals, inequality is reduced both across and within countries. Consumption is oriented toward low material growth and lower resource and energy intensity.
SSP3: Regional Rivalry (a rocky road); A resurgent nationalism, concerns about competitiveness and security, and regional conflicts push countries to increasingly focus on domestic or, at most, regional issues. Policies shift over time to become increasingly oriented toward national and regional security issues. Countries focus on achieving energy and food security goals within their own regions at the expense of broader-based development. Investments in education and technological development decline. Economic development is slow, consumption is material-intensive, and inequalities persist or worsen over time. Population growth is low in industrialized and high in developing countries. A low international priority for addressing environmental concerns leads to strong environmental degradation in some regions.
SSP5: Fossil-Fueled Development (taking the highway);
This world places increasing faith in competitive markets, innovation and participatory societies to produce rapid technological progress and development of human capital as the path to sustainable development. Global markets are increasingly integrated. There are also strong investments in health, education, and institutions to enhance human and social capital. At the same time, the push for economic and social development is coupled with the exploitation of abundant fossil fuel resources and the adoption of resource and energy intensive lifestyles around the world. All these factors lead to rapid growth of the global economy, while global population peaks and declines in the 21st century. Local environmental problems like air pollution are successfully managed. There is faith in the ability to effectively manage social and ecological systems, including by geo-engineering if necessary.
Sources; https://www.sciencedirect.com/science/article/pii/S0959378016300681?via%3Dihub
https://en.wikipedia.org/wiki/Shared_Socioeconomic_Pathways


Research and
collaboration